mirror of
https://github.com/infiniflow/ragflow.git
synced 2025-12-08 20:42:30 +08:00
### What problem does this PR solve?

Support server health check. Solved issue: #10106

### Type of change

- [x] New Feature (non-breaking change which adds functionality)
110 lines
3.2 KiB
Markdown
110 lines
3.2 KiB
Markdown
---
|
||
sidebar_position: 8
|
||
slug: /run_health_check
|
||
---
|
||
|
||
# Monitoring
|
||
|
||
Double-check the health status of RAGFlow's dependencies.
|
||
|
||
---
|
||
|
||
The operation of RAGFlow depends on four services:
|
||
|
||
- **Elasticsearch** (default) or [Infinity](https://github.com/infiniflow/infinity) as the document engine
|
||
- **MySQL**
|
||
- **Redis**
|
||
- **MinIO** for object storage
|
||
|
||
If an exception or error occurs related to any of the above services, such as `Exception: Can't connect to ES cluster`, refer to this document to check their health status.
|
||
|
||
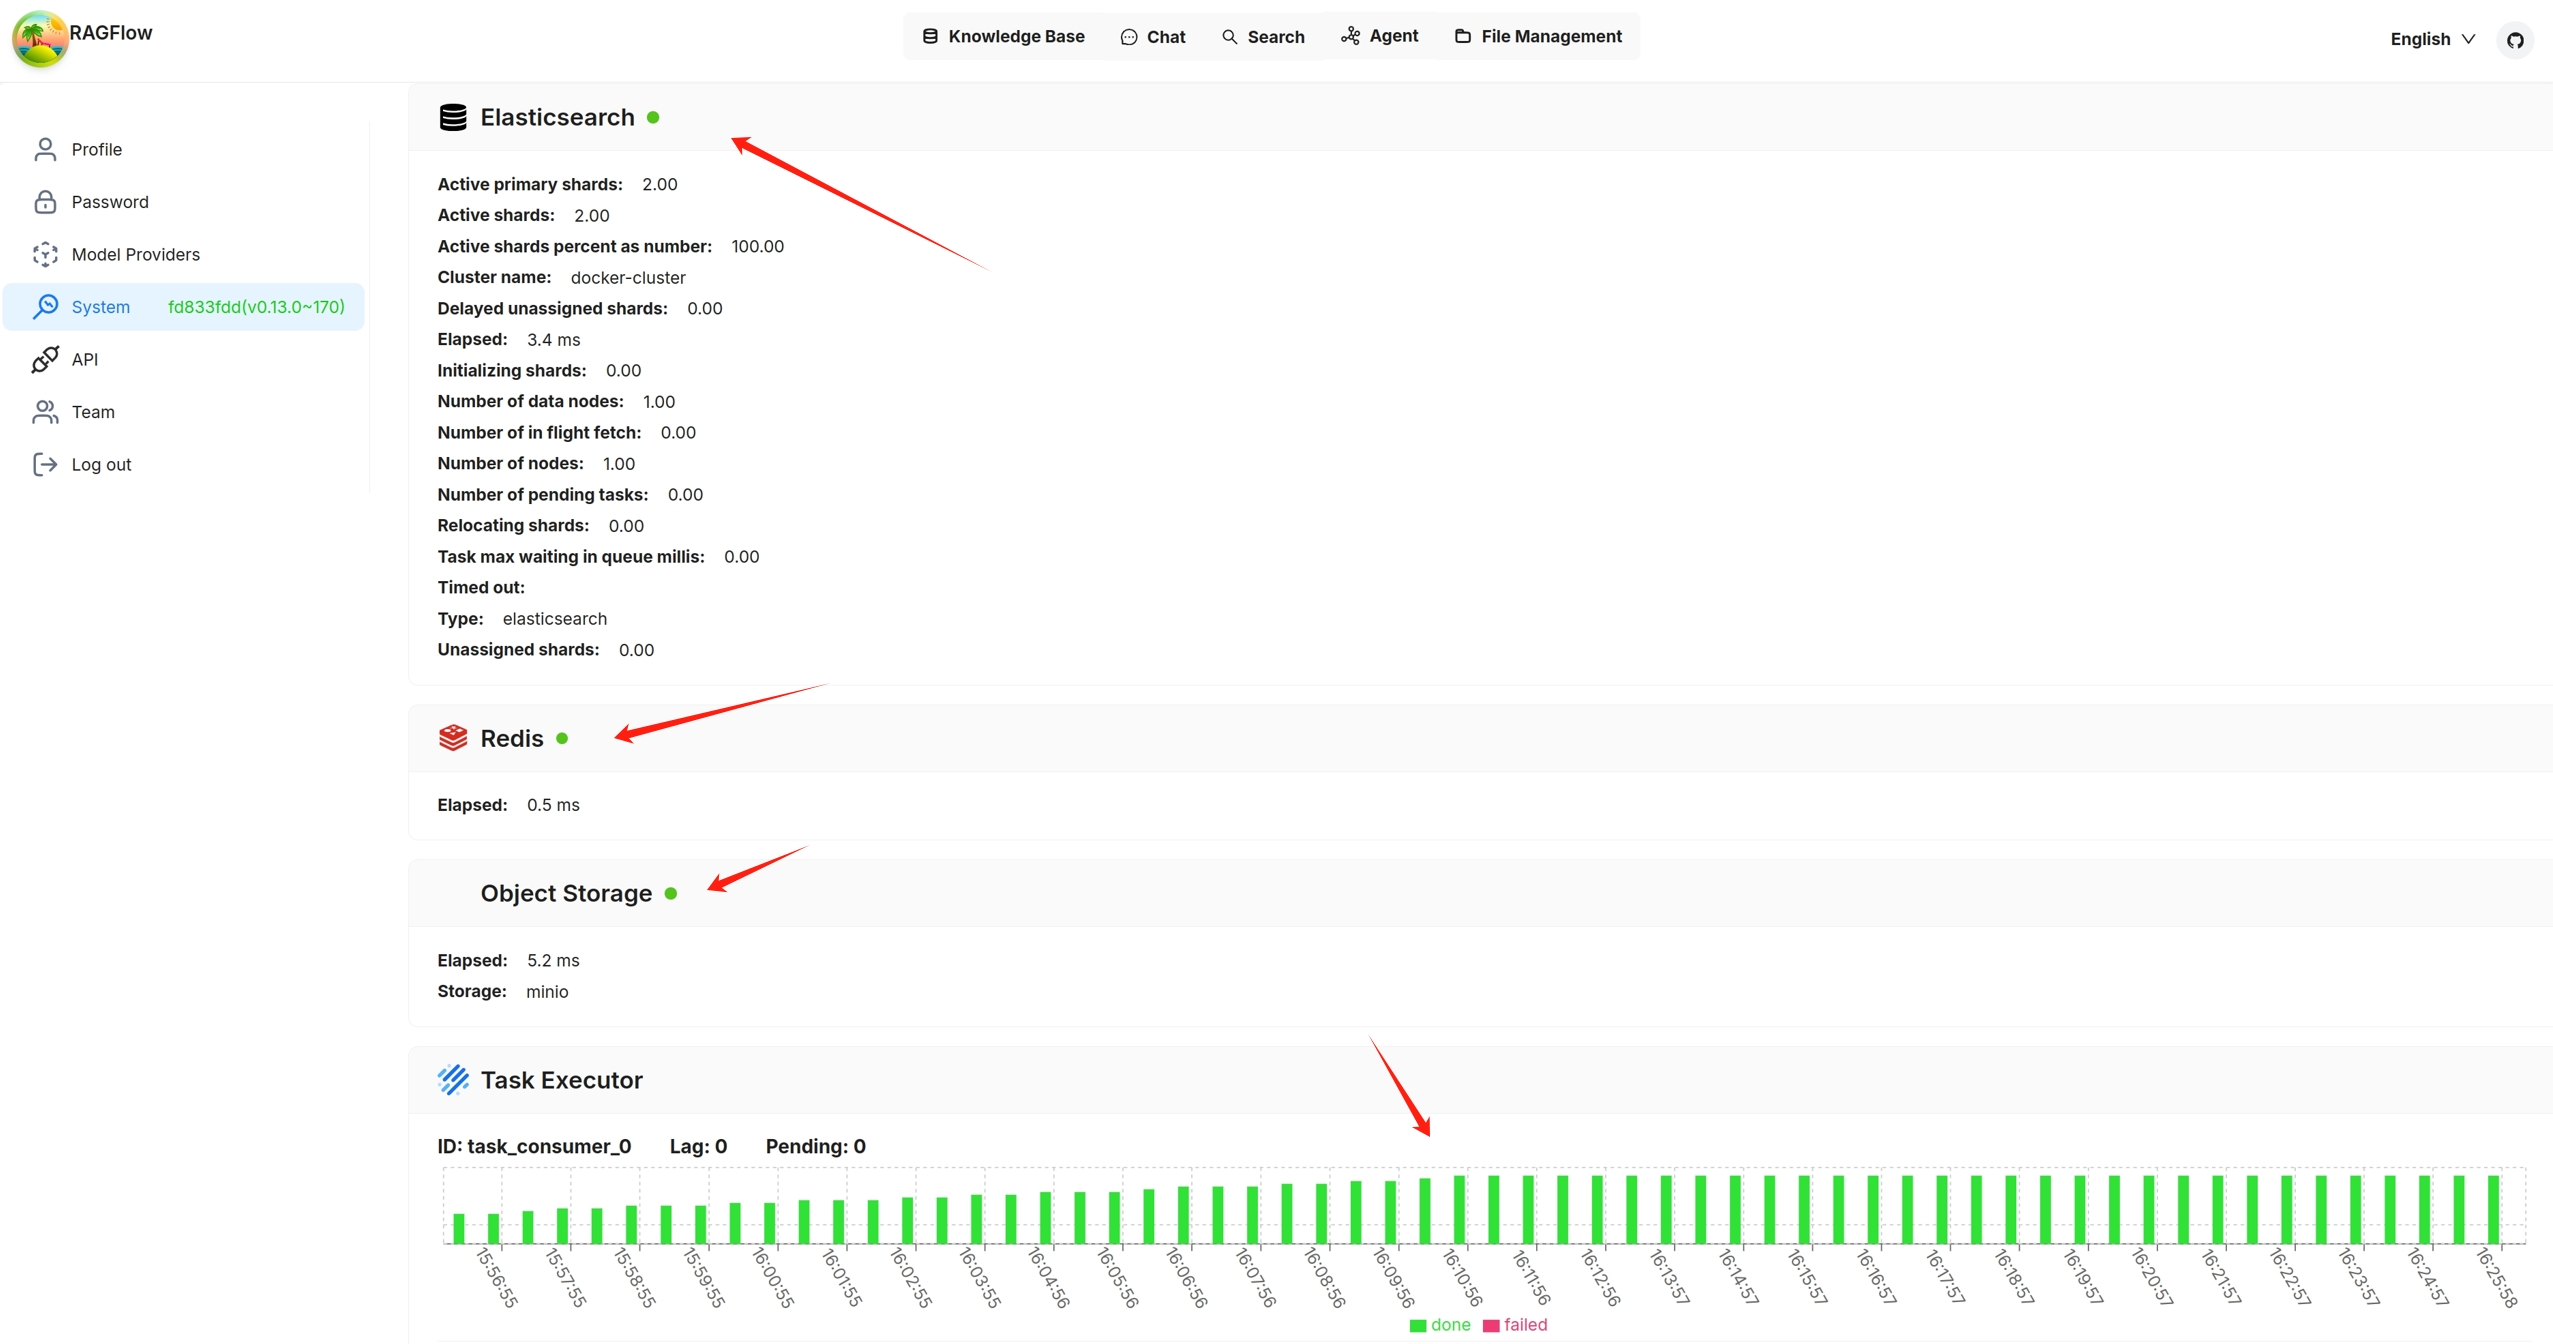
You can also click you avatar in the top right corner of the page **>** System to view the visualized health status of RAGFlow's core services. The following screenshot shows that all services are 'green' (running healthily). The task executor displays the *cumulative* number of completed and failed document parsing tasks from the past 30 minutes:
|
||
|
||
|
||
|
||
Services with a yellow or red light are not running properly. The following is a screenshot of the system page after running `docker stop ragflow-es-10`:
|
||
|
||

|
||
|
||
You can click on a specific 30-second time interval to view the details of completed and failed tasks:
|
||
|
||

|
||
|
||

|
||
|
||
## API Health Check
|
||
|
||
In addition to checking the system dependencies from the **avatar > System** page in the UI, you can directly query the backend health check endpoint:
|
||
|
||
```bash
|
||
http://IP_OF_YOUR_MACHINE/v1/system/healthz
|
||
```
|
||
|
||
Here `<port>` refers to the actual port of your backend service (e.g., `7897`, `9222`, etc.).
|
||
|
||
Key points:
|
||
- **No login required** (no `@login_required` decorator)
|
||
- Returns results in JSON format
|
||
- If all dependencies are healthy → HTTP **200 OK**
|
||
- If any dependency fails → HTTP **500 Internal Server Error**
|
||
|
||
### Example 1: All services healthy (HTTP 200)
|
||
|
||
```bash
|
||
http://127.0.0.1/v1/system/healthz
|
||
```
|
||
|
||
Response:
|
||
|
||
```http
|
||
HTTP/1.1 200 OK
|
||
Content-Type: application/json
|
||
Content-Length: 120
|
||
|
||
```
|
||
|
||
Explanation:
|
||
- Database (MySQL/Postgres), Redis, document engine (Elasticsearch/Infinity), and object storage (MinIO) are all healthy.
|
||
- The `status` field returns `"ok"`.
|
||
|
||
### Example 2: One service unhealthy (HTTP 500)
|
||
|
||
For example, if Redis is down:
|
||
|
||
Response:
|
||
|
||
```http
|
||
HTTP/1.1 500 INTERNAL SERVER ERROR
|
||
Content-Type: application/json
|
||
Content-Length: 300
|
||
|
||
```
|
||
|
||
Explanation:
|
||
- `redis` is marked as `"nok"`, with detailed error info under `_meta.redis.error`.
|
||
- The overall `status` is `"nok"`, so the endpoint returns 500.
|
||
|
||
---
|
||
|
||
This endpoint allows you to monitor RAGFlow’s core dependencies programmatically in scripts or external monitoring systems, without relying on the frontend UI.
|